Methodology
It was a cross-sectional survey of a representative sample at the national level, including 1,862 children and adolescents (6 months and 17 years), allowing the results to be transposed to the entire child and adolescent population of Spain.
The ENALIA survey gathered individual dietary information, firstly on daily diet (specifying type of food and quantity consumed [g/day]) on two separate days and secondly on the frequency of food and food supplement intake. Information was also collected on general socio-demographic characteristics, physical activity carried out and participants’ height and weight.
The dietary information was collected through questionnaires and support material designed ad hoc, following the European methodology and the recommendations contained in the EFSA pilot projects: PANCAKE and PANEU:
- To collect information on daily diet (consumption of food and quantities consumed in grams per day at the different meals of the day), a different methodology was used depending on the age of the participants, differentiating between two main age groups, between 6 months and 10 years and between 11 and 17 years.
In the first age group (population between 6 months and 10 years old) two “dietary diaries” of one day each were kept, in which the foods and quantities consumed were recorded at the moment of each meal. For the second age group (population between 11 and 17 years old), two“24 h recall interviews” were conducted at which the food consumed over the previous 24 hours was recorded at the end of each day. In both age groups, information was collected for two different days, 14 days apart, to estimate the usual consumption and avoid one-off errors of information on a specific day regarding over- or under-consumption. On the first day, the information was collected in a telephone interview and on the second day the interviewer visited the home and conducted a face-to-face interview, taking anthropometric measurements. The quantities consumed were calculated using a photographic atlas of food, especially designed for this survey and conversion tables for homemade measurements.
- To collect the information on the frequency of consumption of food and dietary supplements the “Questionnaire on frequency of consumption” was used. The questionnaire included 44 questions about food and 13 questions about food supplements. The foods included in this questionnaire were selected following two criteria: (1) large groups of food consumed by the majority of the general population and (2) food consumed occasionally but which has been identified as a major source of potentially hazardous agents and/or nutrients.
Field work was carried out by specially trained interviewers with experience in this type of survey between spring 2013 and 2014.
For the classification and coding of the food, the FoodEx2 method proposed by the EFSA for monitoring was used.
The individual consumption data has been sent to the EFSA for inclusion in the European Food Consumption Database (Comprehensive database).
In addition, the information collected has enabled the transformation of the participants' food intake into their nutrient intake (proteins, fats, carbohydrates, minerals and trace elements) and the obtaining of a reference study on the nutritional situation of the infant and adolescent population in Spain.
Details of the methodology used in the survey may be found in the document included in the publications section of this web page (Spanish National Dietary Survey on children and adolescents http://www.efsa.europa.eu/en/supporting/pub/900e)
Results and conclusions
The principal results and conclusions obtained are presented below, together with explanatory tables and graphs, on the daily diet (type and quantities of food consumption), frequency of consumption of food and food supplements and the nutritional study of the infant and adolescent population included in the ENALIA study.
1. Daily diet: type and quantities of food consumption. The tables describing the food consumption data in grams/day are presented below. Two data types are given in each table:
- The first part contains the data referred to the whole population included in the sample by age group (whether or not they ate this food): Mean (to three decimal places), standard deviation (SD), and 95th percentile.
- A second part with the data referring to the interviewees who consumed the food or food group (that is, consumers) in each age group whose key means:
- N: number of times that the consumption of this food is mentioned among the consumers (number of consumptions). Taking into account that the survey was conducted on two different days, some of those surveyed consumed a food on both days and may have eaten it at different times (Br-mid morning-Lu-Tea-Su-before bed). Therefore, there may be more than one consumption per individual.
- %: percentage of consumers: estimated percentage of people (taking as a base the reference population of each age group) that consume a food or food group.
- The mean (to three decimal places), the standard deviation (SD) and the 50th, 75th and 95th percentiles of the quantities consumed among the consumers is also given.
Tables of consumption/day data:
2. Frequency of consumption of foods and food supplements.
Food. The food and beverages marketed as most frequently consumed everyday by Spanish children and adolescents include milk, white bread, fresh fruit or fruit juice and yoghurt.
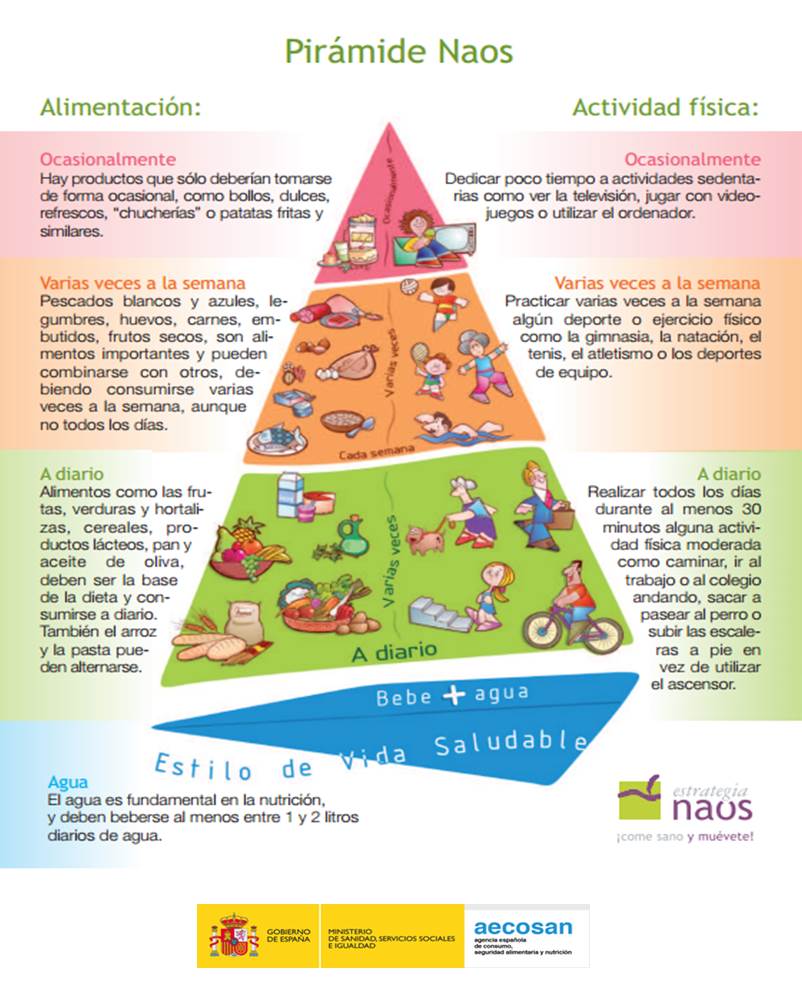
The food pyramid, “NAOS Pyramid”, includes fruit, vegetables, cereals, bread, olive oil and dairy products among the foods that must be eaten every day. ENALIA reveals very positive results for this food group, except for the consumption of vegetables, which were only eaten every day by a third of the population studied. In addition, the high percentage of the population which consumes milk, very important in this age group, as this is a growing population. Fish, pulses, eggs, meat and cold meats and dried fruit and nuts, should be eaten two or three times a week. The results reveal an inadequate intake of some of the foods in this group including pulses and fish, which are eaten less often than recommended: one third of children and adolescents eat pulses and white fish once a week or less often. The consumption of blue fish is even less frequent, as almost half of this population never its. (See Table 1. Frequency of consumption of food and beverages in the Spanish child and adolescent population (n: 1.860) (%)).
Differences in the frequency of consumption by age group. The type of food consumed varies with age. The older the participants the lower the consumption of milk, fruit and vegetables and breakfast cereals and the higher the consumption of white and wholemeal bread. No differences were observed in the consumption of food by gender.
Graphs 1-37 describe the percentage of participants who indicated with what frequency they consumed the different food by age group. Most the foods studied are represented with a relevant interest.
Table 1. Frequency of consumption of food and drink in the Spanish child and adolescent population (n: 1.860) (%). Graphs 1-37. Distribution of Spanish boys, girls and adolescents from the sample aged between 6 months and 17 years old according to the frequency of consumption of the different types of food and beverages and their age group, 2013-2014 (%). See document
Food supplements. The consumption of food supplements is uncommon in this child and adolescent population. Only 7% (131) of the participants mention taking any type of vitamins, minerals or proteins in their daily diet. The majority of these are aged between 6 and 24 months. (See graph 38). The food supplements consumed most frequently on a daily basis are Vitamin D (35.3% of participants), Vitamin C (22.8%), vitamin supplements without minerals (22.6%), and with minerals (20.7%). (See table 2)
Graph 38. Distribution of Spanish boys, girls and adolescents from the sample aged between 6 months and 17 years by use of food supplements and age group, 2013-2014. N: 1859 (%); Table 2. Frequency of use of food supplements in the Spanish child and adolescent population who take them (N: 131). See document
3. Nutritional situation of the child and adolescent population.
The information collected on the consumption of food in the daily diet was used to calculate the nutrients consumed by this population group (macronutrients: proteins, carbohydrates, dietary fibre and lipids and micronutrients: vitamins and minerals). To transform the food into nutrients and energy provided by the same, the Spanish Food Composition Tables prepared by Ortega et al. were used (Ortega et al., 2010; Ortega et al., 2013) together with the Atwater conversion tables respectively.
The energy intake and the usual mean intake of these nutrients was estimated and compared with international standards. This permitted the evaluation of the nutritional situation of this population which will serve as a national reference and its comparison with similar studies in other surrounding countries. In addition, it assessed the quality of the diet according to its adherence to the Mediterranean Diet, as this is considered an effective strategy for the prevention of cardiovascular disease.
ENALIA publications
1.- Nutritional profile of the diet of the child and adolescent population in Spain. ENALIA study
Summary on the nutritional assessment of the ENALIA survey, presented by Ms. Ana María López Sobaler (Department of Nutrition. Faculty of Pharmacy. UCM) at the 10th NAOS Convention, 2016.
2. - Spanish National Dietary Survey on children and adolescents.
3.- Adequacy of Usual Vitamin and Mineral Intake in Spanish Children and Adolescents: ENALIA Study (in press). López-Sobaler AM, Aparicio A, González-Rodríguez LG, Cuadrado-Soto E, Rubio J, Marcos V, et al. Nutrient. 2017;9:131.